

2026-07-29 · 11 min read · Raw Drafts / Interaction Design / User Research / Service Design / Systems
The Product Happens Between the Screens
Interaction design has strong tools for screens, flows and journeys. Interaction sequence maps can expose the hidden choreography of users, interfaces, sensors, services, AI and human recovery.
I opened Adam Jacob’s article about reducing AI token spend because the diagrams looked impressive. I did not understand them at first. They had vertical lines, arrows, loops, boxes and several actors talking to one another. They looked like the kind of technical chart that makes an argument feel more serious before you know what the argument is.
Once I learned how to read them, the diagrams became simple. Time moves downward. Each column is an actor. An arrow means one actor asks another actor to do something. A return arrow means something comes back. A loop means the system repeats itself. The chart is a transcript of coordination.
Jacob used sequence diagrams to reveal why one AI workflow was expensive. The first version used AI agents to coordinate other AI agents. The second moved routing, state, validation and repetition into ordinary software, then called AI only when judgement was needed. The chart made the invisible architecture visible. You could see where the intelligence was being spent.
Interaction design needs something similar.
We have strong visual tools for screens. We have user flows for the path through a product, journey maps for an experience across time and channels, service blueprints for the organization behind the experience, and state diagrams for the conditions a product can enter. Each tool reveals a different layer.
Yet many modern interaction failures happen inside the gaps between those layers. A person acts. A sensor detects something. The interface sends a request. A remote service interprets it. Another system returns an incomplete answer. The product changes state. The person forms the wrong explanation. A worker eventually repairs the situation.
The visible screen is one participant in a much larger conversation.
I think designers need an interaction sequence map: a simplified sequence diagram for showing the exact choreography of a person, interface, device, software system, external service and human support over time.
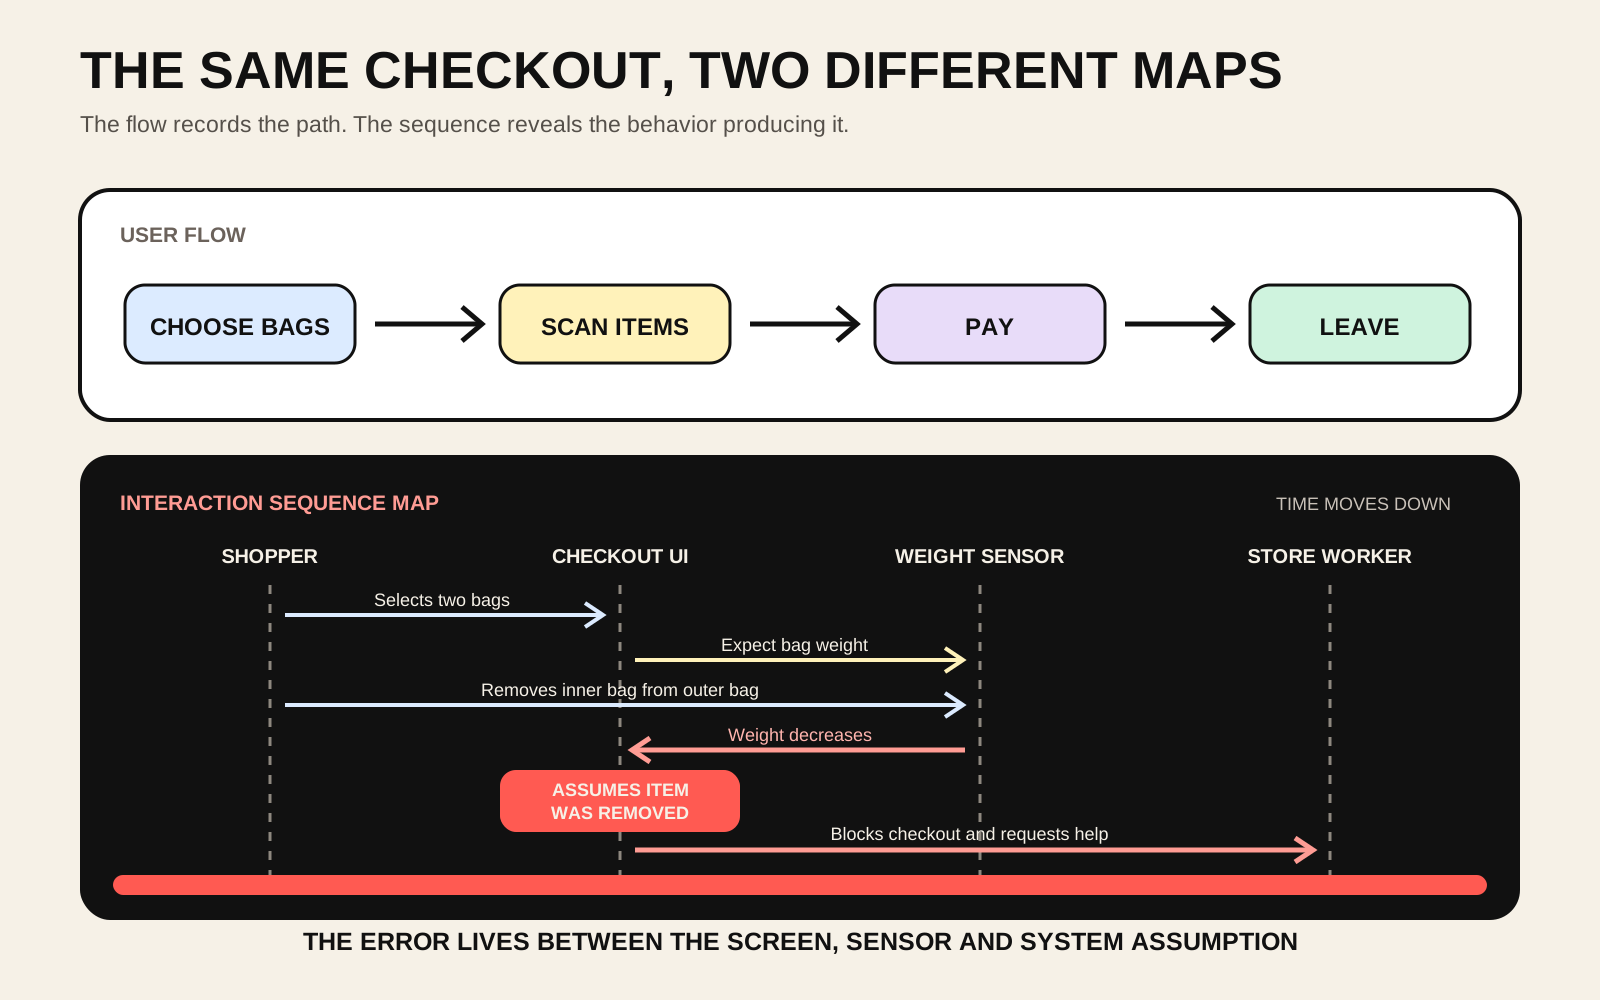
A user flow for a self-checkout might say: choose bags, scan products, pay, leave. It is accurate at the level of screens and tasks. It is also capable of hiding the entire failure.
My checkout incident began with two shopping bags nested inside each other. I selected the bags and placed them on the scale. The machine accepted the weight. When I removed the inner bag from the outer bag, the measured weight changed. The system interpreted that change as a product being removed before scanning. It blocked the checkout until a worker arrived.
The interface did not know I was still preparing the bags. The weight sensor only knew that weight had decreased. The checkout software had a limited set of explanations for that event. Its confidence became an accusation: unexpected item movement. The worker had access to a recovery action that the customer did not.
A screen flow cannot explain this because the important action occurred outside the screen. A journey map could show my frustration, but the emotion alone would not reveal its cause. A service blueprint could place the worker and checkout system into organizational layers, but it might still flatten the exact order of events.
The sequence map shows the causal chain. It shows the moment when a physical action became sensor data, when sensor data became a system assumption, when the assumption changed the interface state and when the blocked state transferred responsibility to a worker.
That chain is the interaction.
The product has more actors than the interface admits
A banking login may involve the user, the app, Face ID, the operating system, a bank server, a risk engine and a notification service. A food-delivery order may involve the customer, app, payment processor, restaurant tablet, courier system, location service and support worker. A medical test may involve the patient, clinic, label printer, courier, laboratory information system, analyser, doctor and national health record.
The person experiences these as one product. The company often builds them as separate systems owned by separate teams.
This creates a recurring design problem. The organization sees components. The user sees continuity.
A sequence map gives the continuity a technical shape without requiring the designer to become a software architect. The designer can ask who initiates each step, what information crosses each boundary, how long the response takes, what the person sees while waiting, what happens when one actor returns nothing, and who gains responsibility when the normal path fails.
The diagram becomes especially useful when the interface reports a state that belongs to another system. “Payment pending” may mean the product sent a request but has not received a result. “Your sample is being processed” may cover collection, transport, accessioning, analysis, validation or clinical review. “The AI is thinking” may hide retrieval, tool calls, policy checks, model generation and post-processing.
One label can compress several systems into one reassuring sentence. The sequence map lets the designer inspect whether that sentence is honest.
A microscope inside the journey map
Journey maps remain useful because experiences unfold across days, weeks, places and channels. Nielsen Norman Group describes journeys as broad, high-level experiences, while user flows zoom into specific interactions within one product. An interaction sequence map can sit one level deeper again.
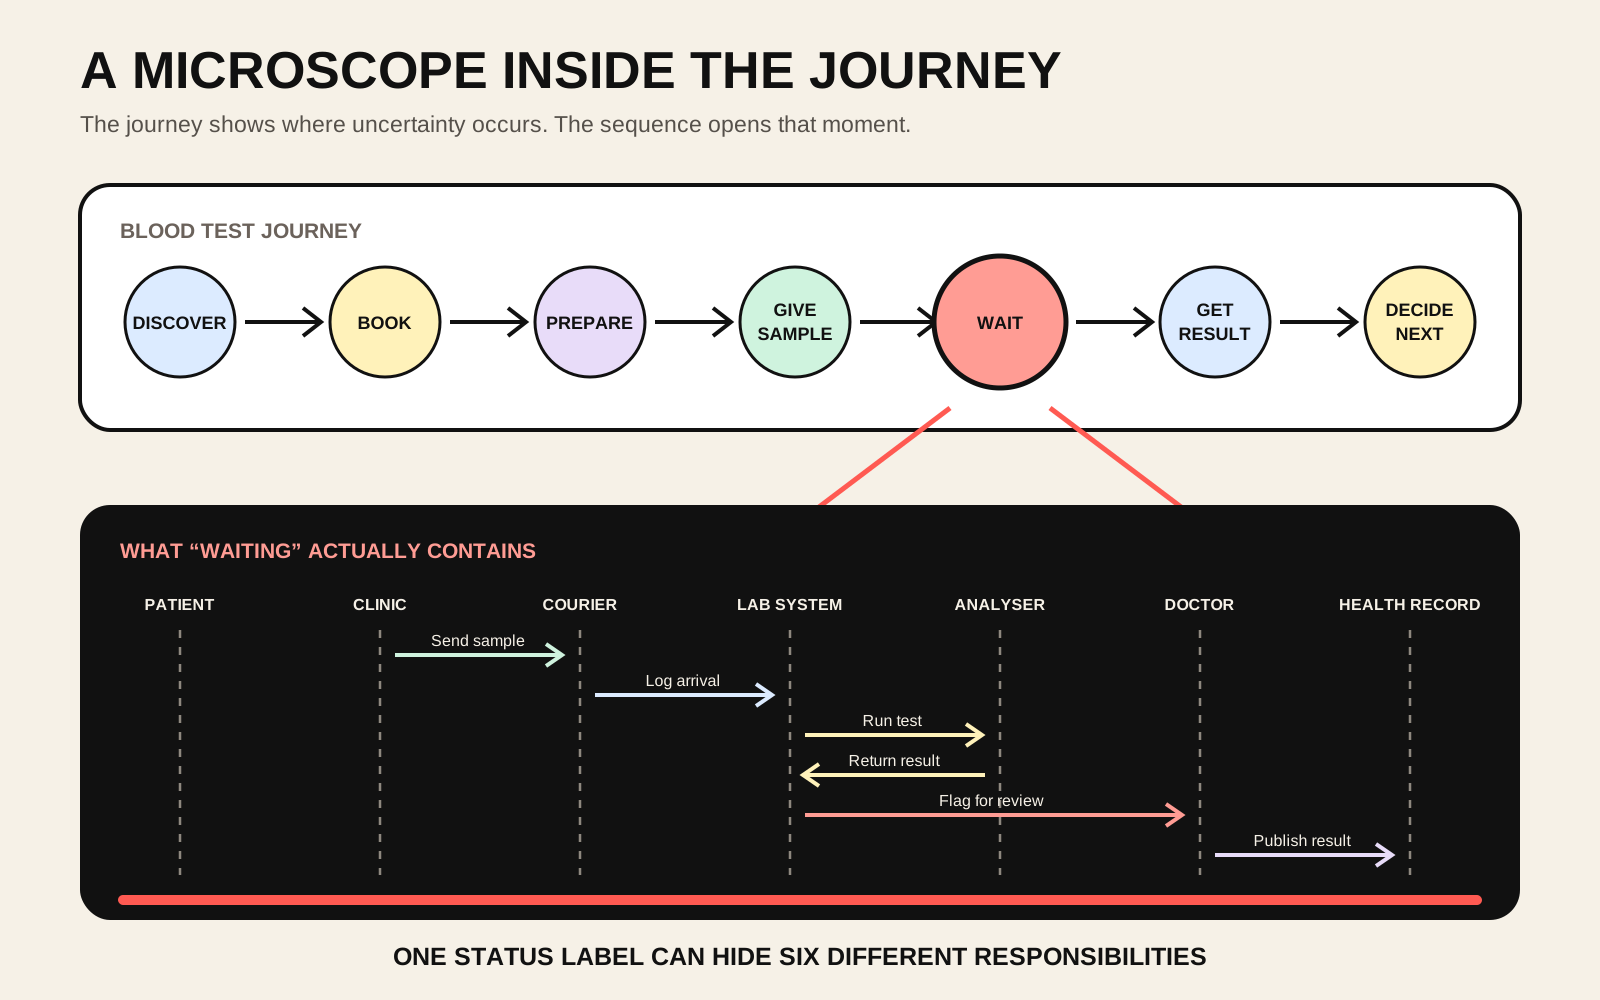
Imagine a blood-test journey: discover a test, book it, prepare, provide a sample, wait, receive a result and decide what to do next. The journey map can capture expectations, fear, confusion and the channels involved. It can show that the waiting stage is emotionally difficult.
The sequence map can open the waiting stage and ask what waiting actually contains.
Has the sample reached the laboratory? Was its label accepted? Is it queued for analysis? Did the analyser flag a technical problem? Does an abnormal result require human validation? Has the result entered the national health system? Is the clinic delaying publication until a doctor adds an explanation? Can the patient see that responsibility has moved from one actor to another?
A generic status bar may show all of this as “processing.” The diagram reveals several different kinds of uncertainty that may need different interface responses.
This matters for the medical laboratory network I want to build. The patient-facing product will only be trustworthy when the chain of custody, data transformations, verification steps and clinical responsibility are designed as one experience. The laboratory interface is the visible edge of an operational system. Designing the screen without designing that sequence would produce a polished window into confusion.
User research becomes a timeline of evidence
Interaction sequence maps can also change how usability studies are documented.
A research report often separates evidence by format. The video recording sits in one place. The moderator’s notes sit elsewhere. Analytics show clicks but not interpretations. System logs show requests but not hesitation. Interview quotes are grouped into themes after the event. Each source describes a different part of the same experience.
A sequence map creates one timeline where these sources can meet.
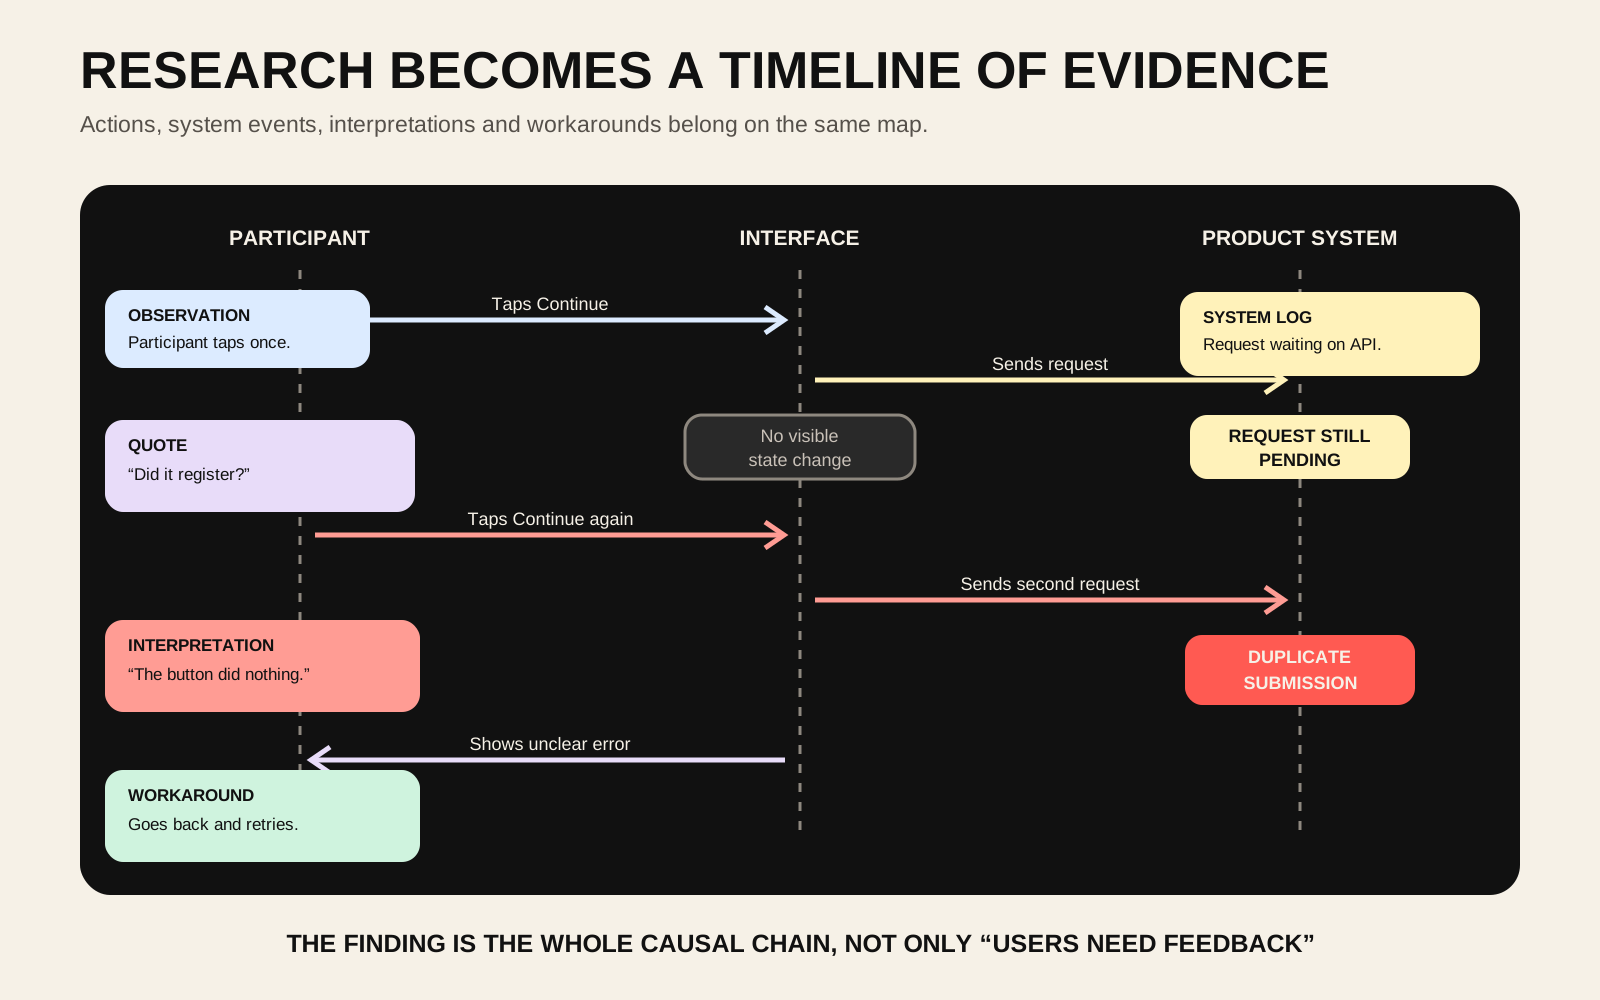
The participant taps Continue. The interface gives no immediate response. The system log shows that a request is still pending. The participant says, “Did it register?” They tap again. The second request creates a duplicate submission. They go back and unknowingly interrupt the first process.
A conventional finding might say that users need clearer feedback. The sequence map preserves more of the mechanism. It shows when confidence fell, what the system was doing at that moment and how the person’s attempt to recover created a second problem.
The most useful comparison may be between the designed sequence and the observed sequence.
The designed sequence says: tap Book, receive confirmation, receive email. The observed sequence says: tap Book, see spinner, tap again, create duplicate booking, call support. The distance between those sequences is a measurable form of interaction debt.
This also makes research easier to hand to engineering. Each arrow can become an interface response, event, requirement or test case. The research finding remains connected to the behavior that produced it instead of becoming a detached sticky note called “users are confused.”
AI makes the hidden sequence larger
AI interfaces make this method more urgent.
A chat box suggests a simple relationship between one person and one intelligence. The actual sequence may involve an orchestrator, several models, search, memory, safety systems, external tools, databases and human approval. Parts of the response may stream before other parts have finished. A tool may fail after the model has already implied that it succeeded. The system may remember some information, retrieve other information and silently discard the rest.
The designer needs to decide which parts of that sequence should become visible.
Should the person know that external research is happening? When should citations appear? What does Stop actually stop? Can already streamed text be revised? When does an action require confirmation? What happens when the model succeeds but the tool fails? Which actor owns the final claim?
These questions are difficult to resolve with a collection of chat screens. The screen is visually stable while the underlying sequence changes radically.
A useful AI prototype therefore needs two layers. One layer shows what the person sees. The other shows what the system is doing and what evidence supports each transition. Without the second layer, designers may prototype an experience whose technical behavior is impossible, unsafe or misleading.
Design recovery before success
Sequence maps naturally expose loops, branches and interrupted states. This makes them useful for error recovery, which design files often postpone until the happy path is complete.
A payment can succeed, fail, time out, remain pending, be duplicated or complete remotely after the local interface has given up. A medical result can be technically valid but awaiting clinical review. A delivery can be cancelled in one system while still moving through another. An AI action can produce a plausible answer after the requested operation has failed.
Each state needs a different recovery sequence.
The key questions are practical. Can the person safely retry? Could retrying duplicate the action? Who can determine the true state? Is there a point where the interface must stop pretending to know? Can support see the same history as the user? Does context survive the handoff?
A product that handles success beautifully and recovery poorly is revealing its real organizational structure. The normal path belongs to the interface. The failure belongs to whoever can be reached.
Sequence maps make that transfer visible before users discover it.
A deliberately smaller language
Full UML sequence diagrams contain more notation than most interaction designers need. The useful adaptation should remain small enough to draw during research synthesis or a design critique.
I would begin with six possible columns: person, interface, device or operating system, product system, third party and human support. Most diagrams would use only the actors relevant to the moment.
The arrows would show actions, requests, responses and delayed notifications. Boxes would show loops and alternative outcomes. A visible marker would identify waiting, uncertainty, breakdown and recovery. Research evidence could be attached directly to the event as an observation, quote, system log or metric.
Four measurements could sit beside important moments: effort, wait, certainty and recovery. How much work did the person perform? How long did useful feedback take? Did the person understand the current state? Could they recover without another human?
The method would begin with one critical moment rather than an entire product. Draw the sequence that was intended. Reconstruct the sequence that actually occurred. Compare the two. Find the hidden actors, false assumptions, unexplained waits, repeated work and broken handoffs. Then design a better sequence before redesigning the screen.
The output is more than documentation. It can become a shared object between research, design, engineering, operations and support. Each group sees its own part of the experience while remaining inside the same timeline.
Screens are snapshots of a running system
Interaction design has often treated screens as the primary material and behavior as the connection between them. That made sense when products were mostly pages and direct responses. It makes less sense when a single tap can trigger sensors, identity systems, payment networks, AI models, logistics systems, laboratory workflows and human review.
The product is increasingly the coordination itself.
A screen shows one moment in that coordination. A flow shows the expected path through several moments. A journey shows how those moments accumulate into an experience. An interaction sequence map shows why each moment happened.
That is the missing view I saw inside Adam Jacob’s charts. He used sequence diagrams to find where an AI system was spending intelligence. Interaction designers could use them to find where a product is spending human effort, trust and patience.
The most important part of the interface may be the part no screen contains.
The product happens between the screens.
Connected reading
- The Checkout Robot Accused Me Before I Started Shopping
- AI Makes Organizational Mess Executable
- The Most Dangerous Interface Is the One That Says Everything Worked
- The App Has Received Your Uncertainty
- The Report Is a Form
- Your DNA Is Finished, but the Product Cannot Be
AI authorship note
This essay began with Kris Haamer encountering Adam Jacob’s sequence diagrams, asking how the same visual language could be useful for interaction design, and connecting the method to his self-checkout bag incident and future medical laboratory network. AI supported the research, method development, drafting, editing, SVG diagrams, metadata and publishing workflow. Kris supplied the original observations, selected the interaction-design framing and approved the article for publication.